28 Soluciones para evaluar cuando necesitamos graficar informacion en nuestros portales… Enjoy!
Ajax.org Platform is a pure javascript application framework for creating real-time collaborative applications that run in the browser.

AnyChart
AnyChart is a flexible Flash based solution that allows you to create interactive and great looking flash charts.

Axiis
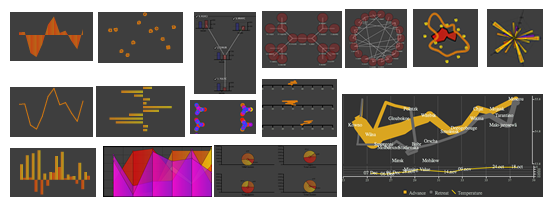
Axiis is a Data Visualization Framework for Flex. It has been designed to be a concise, expressive, and modular framework that let developers and designers create compelling data visualization solutions.
Also, take a look at the nice window-in-window design on the saturnboy blog.

BirdEye
BirdEye is a community project to advance the design and development of a comprehensive open source information visualization and visual analytics library for Adobe Flex. The actionscript-based library enables users to create multi-dimensional data visualization interfaces for the analysis and presentation of information.
Degrafa
Degrafa is a declarative graphics framework for creating rich user interfaces, data visualization, mapping, graphics editing and more.

DojoX Data Chart
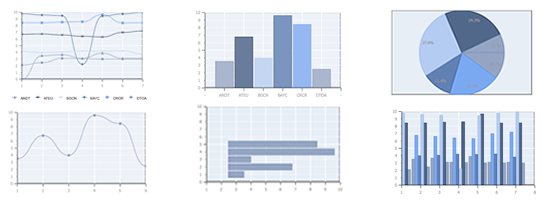
An addition in the Dojo 1.3 release is the new dojox.charting class. Its primary purpose is to make connecting a chart to a Data Store a simple process.
Chronoscope
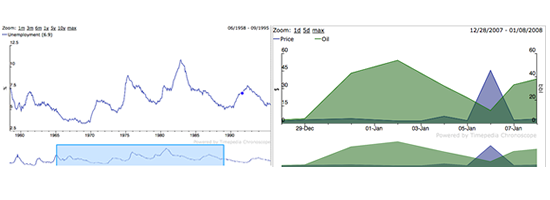
If you need to visualize thousands or millions of points of data, check this out. Very well designed and can be navigated with the keyboard or mouse. There's a Javascript API, a Google Visualization API or try it as a Google Gadget on Google Spreadsheets, iGoogle, or Open Social.
Dundas
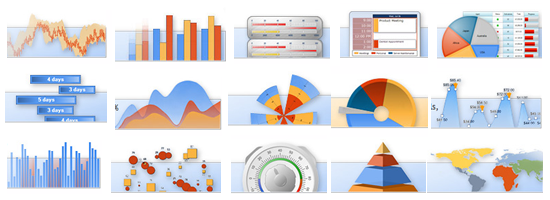
Dundas has a wide range of data visualization solutions for Microsoft technologies. They offer a number of data visualization tools including: Chart, Gauge, Map and Calendar for .net and Dashboards for Silverlight.
ExtJs
Ext JS is a cross-browser JavaScript library for building rich internet applications. It now includes charts.
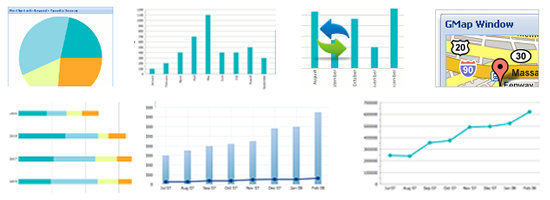
Flex
Flex has built in chart controls: area, bar, bubble, candlestick, column, HLOCC, Line, Pie, Plot. Quick tutorial here that can get you up and running with nicely styled charts using effects.
Flex uses FXG, a graphical interchange format developed by Adobe and is similar in many ways to SVG. Nice article here by James Whittaker looking at FXG and Degrafa. And you should definitely have this book on your desk if you are using Flex: Creating Visual Experiences with Flex 3.0.

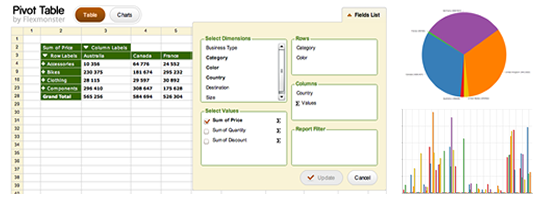
FlexMonster Pivot Table and Charts
Flexmonster provides Pivot table Flex/Flash components rich internet application (RIA) development services.
FusionCharts
Animated flash charts for web apps. Looks like they work with most technologies.
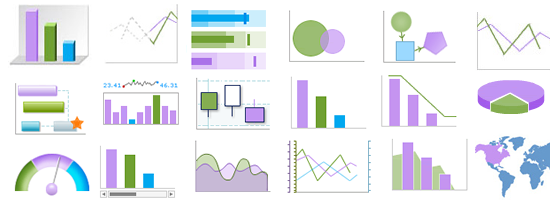
Google Chart API
The Google Chart API lets you dynamically generate charts.
gRaphaël
gRaphaël is a Javascript library to help you create stunning charts on your website.
iLog Exlixir
Enhance data visualization within Flex and AIR applications with IBM ILOG Elixir.
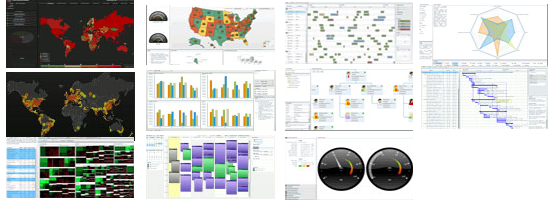
JFreeChart
Creates charts such as bar charts, line charts, pie charts, time series charts, candlestick charts, high/low/open/close charts, wind plots, and meter charts. I wish these charts looked better out of the box, because the features and functionality are good, but the visual design really detracts from the graphs. JFreeChart guys- email me- together we can make the world of JFreeChart a prettier place.

JQuery Plugins
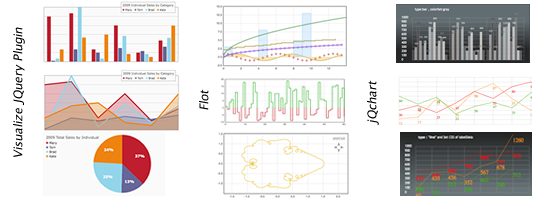
There ar a lot of JQuery chart pugins:
- Visualize by the Filament Group
- JQChart
- Flot
- Sparklines
- TufteGraph
JPowered
The PHP graphing scripts provide a very easy way to embed dynamically generated graphs and charts into PHP applications and HTML web pages.
I can only hope that CSS can make these look better. I'll do a follow up post on how to make your charts aesthetically pleasing.

JSCharts
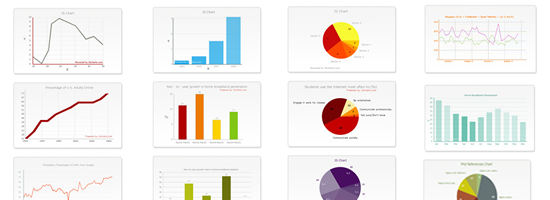
JS Charts is a JavaScript chart generator that requires little or no coding. JS Charts allows you to easily create charts in different templates like bar charts, pie charts or simple line graphs.
Kap IT Labs Diagrammer and Visualizer
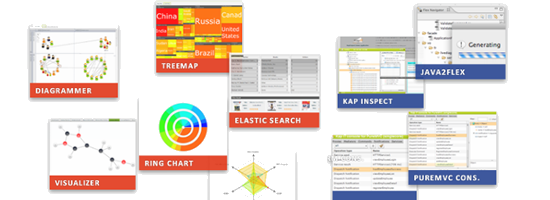
Kap Lab's Diagrammer provides ready-to-use yet highly customizable multi-layout data visualization and diagramming for Adobe Flex and Air.
Visualizer displays data as graphs to better visualize connections. Kap Lab's Visualizer provides ready-to-use yet highly customizable multi-layout data visualization for Adobe Flex and Air.
MilkChart
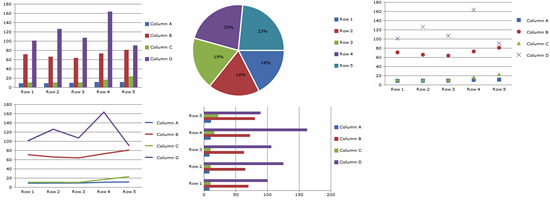
A simple to use, yet robust library for transforming table data into a chart. This library uses the HTML5 tag and is only supported on browsers other than IE until ExCanvas gets proper text support.
Open Flash Charts
Open source Flash charts.

PlotKit
PlotKit is a Chart and Graph Plotting Library for Javascript. It has support for HTML Canvas and also SVG via Adobe SVG Viewer and native browser support.
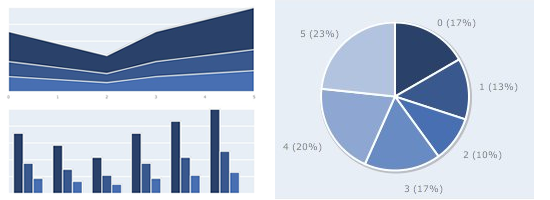
Protovis
Protovis composes custom views of data with simple marks such as bars and dots. Unlike low-level graphics libraries that quickly become tedious for visualization, Protovis defines marks through dynamic properties that encode data, allowing inheritance, scales and layouts to simplify construction.

Silverlight
Microsoft Silverlight comes with the bar, line, pie, column, and scatter charts.

Telerik Charts for Silverlight, WFP, ASP.NET
Telerik Charts offers rich functionality and data presentation capabilities.
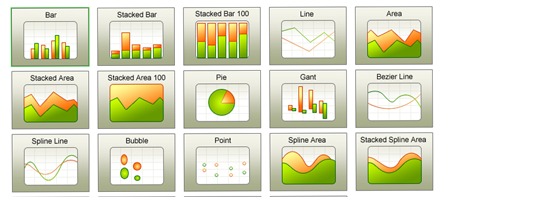
VisiFire
Visifire is a set of open source data visualization controls - powered by Microsoft® Silverlight™ & WPF.

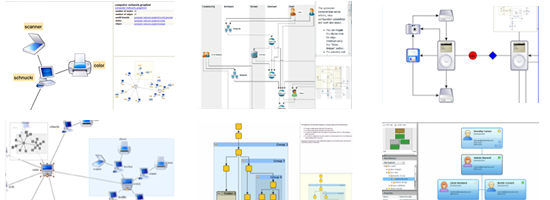
yFiles for Ajax , .NET or Flex
The yFiles product family means state-of-the-art software components for the visualization of networks and diagrams. Unequaled automatic diagram layout, cutting edge graph analysis, and extraordinary visualization.


No hay comentarios.:
Publicar un comentario